Monday, December 27, 2010


Returns for week ending 12/24/10

Model portfolio, hypothetical returns for past…
1 week: -0.1%

Value of $10,000 invested at inception in 2003: $54,540

Sunday, December 19, 2010


Returns for week ending 12/17/10

Model portfolio, hypothetical returns for past…
1 week: -01.6%

Value of $10,000 invested at inception in 2003: $54,658

Tuesday, December 14, 2010


Returns for week ending 12/10/10

Model portfolio, hypothetical returns for past…
1 week: -0.8%

Value of $10,000 invested at inception in 2003: $55,534

Thursday, December 9, 2010

I'll be out of town and unable to update the portofolio until mid week. Just maintain your current positions until I send out the update. That's what I'm doing in my accounts and those that I manage.

Sunday, December 5, 2010


Returns for week ending 12/3/10

Model portfolio, hypothetical returns for past…
1 week: -0.14%

Value of $10,000 invested at inception in 2003: $55,996

Sunday, November 28, 2010


Returns for week ending 11/26/10

Model portfolio, hypothetical returns for past…
1 week: +1.21%

Value of $10,000 invested at inception in 2003: $56,074

Monday, November 22, 2010


Returns for week ending 11/19/10

Model portfolio, hypothetical returns for past…
1 week: -0.82%

Value of $10,000 invested at inception in 2003: $55,429

Sunday, November 14, 2010


Returns for week ending 11/12/10

Model portfolio, hypothetical returns for past…
1 week: +0.67%

Value of $10,000 invested at inception in 2003: $55,885

Monday, November 8, 2010


Returns for week ending 11/05/10

Model portfolio, hypothetical returns for past…
1 week: +1.9%

Value of $10,000 invested at inception in 2003: $55,511

Sunday, October 31, 2010


Returns for week ending 10/29/10

Model portfolio, hypothetical returns for past…
1 week: +2.02%

Value of $10,000 invested at inception in 2003: $54,473

Sunday, October 24, 2010


Returns for week ending 10/22/10

Model portfolio, hypothetical returns for past…
1 week: -1.48%

Value of $10,000 invested at inception in 2003: $53,396

Sunday, October 17, 2010


Returns for week ending 10/15/10

Model portfolio, hypothetical returns for past…
1 week: +2.41%

Value of $10,000 invested at inception in 2003: $54,200

.

Monday, October 11, 2010


Returns for week ending 10/8/10

Model portfolio, hypothetical returns for past…
1 week: -3.19%

Value of $10,000 invested at inception in 2003: $52,926

Sunday, October 3, 2010


Returns for week ending 10/1/10

Model portfolio, hypothetical returns for past…
1 week: -0.7%

Value of $10,000 invested at inception in 2003: $54,668

Saturday, September 25, 2010


Returns for week ending 9/24/10

Model portfolio, hypothetical returns for past…
1 week: +2.0%

Value of $10,000 invested at inception in 2003: $55,054

Wednesday, September 22, 2010

Don't be concerned that we are making changes to the portfolio mid-week. There is always some randomness in the price behavior of stocks and as it turns out, the stocks that we are selling have out-performed the stocks that we are buying this week so our portfolio actually profited from the delay of a couple of days.

The reason for the delay is that my data provider was unable to deliver the data to me over the weekend. This is the first time this has happened in over 6 years, and I expect it is a one-time thing.

-Steve

Returns for week ending 9/17/10

Model portfolio, hypothetical returns for past…
1 week: -0.7%

Value of $10,000 invested at inception in 2003: $53,972

Sunday, September 19, 2010

No update until Monday. My data provider is resolving some issues and hopes to have the necessary data available tomorrow. For this week only, we will enter our trades a day later than usual... before the market opens on Tues.

Sunday, September 12, 2010


Returns for week ending 9/10/10

Model portfolio, hypothetical returns for past…
1 week: +1.3%

Value of $10,000 invested at inception in 2003: $54,340

Saturday, September 4, 2010


Returns for week ending 9/3/10

Model portfolio, hypothetical returns for past…
1 week: +2.9%

Value of $10,000 invested at inception in 2003: $53,640

Saturday, August 28, 2010


Returns for week ending 8/27/10

Model portfolio, hypothetical returns for past…
1 week: -1.2%

Value of $10,000 invested at inception in 2003: $52,130

Saturday, August 21, 2010


Returns for week ending 8/20/10

Model portfolio, hypothetical returns for past…
1 week: +2.6%

Value of $10,000 invested at inception in 2003: $52,765

Sunday, August 15, 2010

note from Steve re: model portfolio's recent performance

In the 16 weeks since I wrote my April note to you, I'm encouraged that the model portfolio has begun to perform more in line with its design goals and past performance. While overall returns are a quite moderate 2.1%, or 6.3% annualized, it has significantly outperformed its market benchmark.

This can be attributed to two key factors... 1) The model portfolio's engine (the 10-stock portfolio) has outperformed the market, generating "alpha", and 2) The model portfolio's hedge position (TWM) has profited from the market's recent decline. For those of you using the FolioInvesting platform, this performance data is readily available via chart by entering a "start date" of 4/23/10.

S&P 500 Index: -10.7%
Model Portfolio: +2.1% (hypothetical)

... resulting in model porfolio returns that are nearly 13% better than the market over the past 16 weeks. Annualized, this amounts to +38% "outperformance", which is close to the model's historical performance over the past 7 years.

Of course, past performance is no guarantee of future returns! And your actual results will vary based on timing of your actual trades, and/or your portfolio's position sizes.

Since my April note, the position size in my managed portfolios has been approximately 1/2 that of the model portfolio's, so my actual gains are about 1/2 that shown above. I do intend to keep my position size at current levels until the model portfolio is showing solid gains over both the 13-week (one quarter) and 26-week (6 months) timeframes. I'll inform you here in advance when I decide to increase my position size to match the model's. Stay posted!

Returns for week ending 8/13/10

Model portfolio, hypothetical returns for past…
1 week: +1.9%

Value of $10,000 invested at inception in 2003: $51,447

Sunday, August 8, 2010


Returns for week ending 8/6/10

Model portfolio, hypothetical returns for past…
1 week: +3.3%

Value of $10,000 invested at inception in 2003: $50,484

Monday, August 2, 2010


Returns for week ending 7/30/10

Model portfolio, hypothetical returns for past…
1 week: -0.8%

Value of $10,000 invested at inception in 2003: $48,850

Saturday, July 24, 2010


Returns for week ending 7/23/10

Model portfolio, hypothetical returns for past…
1 week: -0.8%

Value of $10,000 invested at inception in 2003: $49,251

Monday, July 19, 2010


Returns for week ending 7/16/10

Model portfolio, hypothetical returns for past…
1 week: +0.6%

Value of $10,000 invested at inception in 2003: $49,632

Saturday, July 10, 2010


Returns for week ending 7/9/10

Model portfolio, hypothetical returns for past…
1 week: +0.4%

Value of $10,000 invested at inception in 2003: $49,328

Monday, July 5, 2010


Returns for week ending 7/2/10

Model portfolio, hypothetical returns for past…
1 week: -3.3%

Value of $10,000 invested at inception in 2003: $49,127

Saturday, June 26, 2010


Returns for week ending 6/25/10

Model portfolio, hypothetical returns for past…
1 week: -0.1%

Value of $10,000 invested at inception in 2003: $50,800

Saturday, June 19, 2010


Returns for week ending 6/18/10

Model portfolio, hypothetical returns for past…
1 week: +0.1%

Value of $10,000 invested at inception in 2003: $50,866

Saturday, June 12, 2010


Returns for week ending 6/11/10

Model portfolio, hypothetical returns for past…
1 week: +1.6%

Value of $10,000 invested at inception in 2003: $50,804

Monday, June 7, 2010


Returns for week ending 6/4/10

Model portfolio, hypothetical returns for past…
1 week: -1.42%

Value of $10,000 invested at inception in 2003: $49,995

Monday, May 31, 2010


Returns for week ending 5/28/10

Model portfolio, hypothetical returns for past…
1 week: +3.9%

Value of $10,000 invested at inception in 2003: $50,713

Sunday, May 23, 2010


Returns for week ending 5/21/10

Model portfolio, hypothetical returns for past…
1 week: +0.1%

Value of $10,000 invested at inception in 2003: $48,800

Sunday, May 16, 2010


Returns for week ending 5/14/10

Model portfolio, hypothetical returns for past…
1 week: +0.3%

Value of $10,000 invested at inception in 2003: $48,732

Sunday, May 9, 2010


Returns for week ending 5/7/10

Model portfolio, hypothetical returns for past…
1 week: -3.0%

Value of $10,000 invested at inception in 2003: $48,587

Monday, May 3, 2010


Returns for week ending 4/30/10

Model portfolio, hypothetical returns for past…
1 week: -0.6%

Value of $10,000 invested at inception in 2003: $50,111

Sunday, April 25, 2010


Returns for week ending 4/23/10

Model portfolio, hypothetical returns for past…
1 week: -0.8%

Value of $10,000 invested at inception in 2003: $50,406

Note from Steve re: models portfolio's recent performance


Dear friends and family,

The model portfolio's performance has been disappointing over the past 12 months as the market has rebounded from a historic bottom.

Why? In short, the model portfolio's stocks (the portfolio's engine) have failed to outperform the market. There are many plausible reasons for this related to the nature of this bounce back rally, but the reality is that our stocks have not recently produced excess returns. As a result, because the model portfolio's stocks are largely hedged against the general market, the model portfolio has not only underperformed the market but has actually produced a moderate loss (-15% since the model portfolio's all-time high point) in the past 12 months. This is a huge disappointment to me and is surely distressing to anybody that invested in the model portfolio's holdings near the market bottom of March 2009, after being buffeted by the market's huge losses of 2008-09.

To gain perspective on the model portfolio's performance, it is helpful to look at the model's performance over the full market cycle (since the market peaked in 2007) and also since the model's inception in 2003. The two charts posted here will hopefully provide some useful insight, especially if you share my long-term orientation.

As the charts show, the model has proved to produce huge gains when in-phase with the market conditions, such as the period from May 2003 to March 2009 when it piled up a cumulative gain of 768%. And over the past year while the model has been out-of-phase with the market conditions, it has produced a loss of approximately -15%. That is a very attractive risk-return in my book.

Because it is clear the model is currently out-of-phase with the market conditions and is getting near its designed maximum loss limit of -20%, I am reducing the position size in my personal portfolios and those that I manage for friends and family. Once I see that the model portfolio is again pumping out profits over a 13-week (3 month) and 26-week (6 month) timeframe I will return to a normal position size in my portfolios.

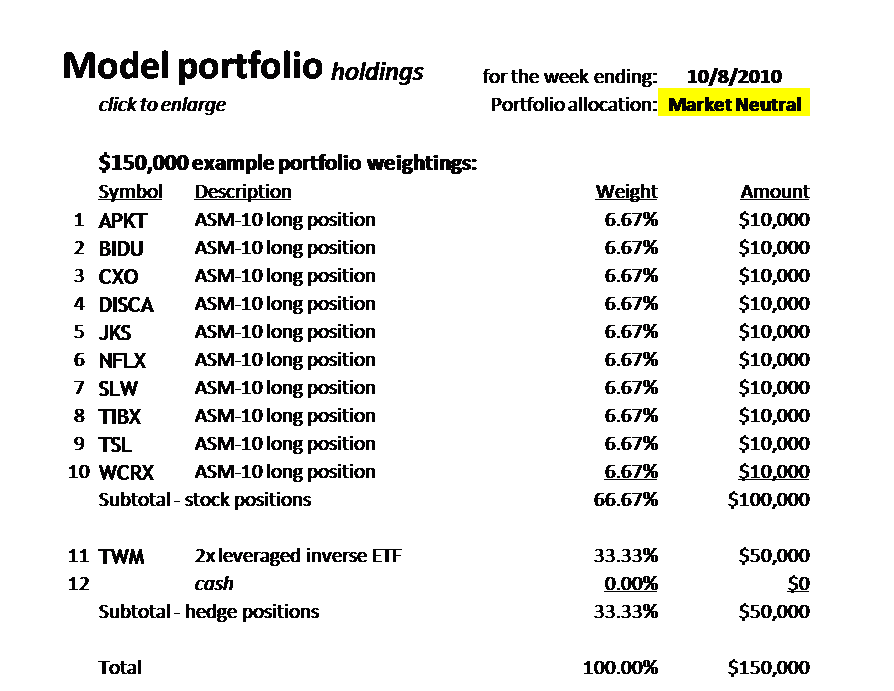
What does this mean? As an example, instead of investing $10,000 per holding as per the model portfolio shown here, I will now invest $5,000 per holding, and thereby hold more cash. This will dampen our risk, but at some cost because it will also reduce the opportunity for gain in the first weeks of an upturn in the model's performance. This is a good time to be prudent and there is no need to swing for the fences since clearly the model is not currently behaving as expected. By keeping the majority of our capital intact, we will be in position to take advantage of the next opportunity for outsized gains.

Note that the weekly results shown on this blog will continue to be based on a full position size for each holding. Also note that your actual performance my vary somewhat from the model portfolio's due to tracking error... e.g. since our actual trades are executed on Monday whereas the model portfolio's returns are based on Friday's closing prices. Rest assured that I also see tracking error in my personal portfolios because my trades are also placed on Monday, same as yours.

Please feel free to send me an email with any questions or comments and I will do my best to respond. Due to my desire to protect the anonymity of everybody here, I won't be responding to any comments posted on this blog.

Sunday, April 18, 2010


Returns for week ending 4/16/10

Model portfolio, hypothetical returns for past…
1 week: -2.2%

Value of $10,000 invested at inception in 2003: $50,798

Sunday, April 11, 2010


Returns for week ending 4/9/10

Model portfolio, hypothetical returns for past…
1 week: -0.50%

Value of $10,000 invested at inception in 2003: $51,938

Monday, April 5, 2010


Returns for week ending 4/2/10

Model portfolio, hypothetical returns for past…
1 week: -0.90%

Value of $10,000 invested at inception in 2003: $52,173

Sunday, March 28, 2010


Returns for week ending 3/26/10

Model portfolio, hypothetical returns for past…
1 week: +0.22%

Value of $10,000 invested at inception in 2003: $52,636

Sunday, March 21, 2010


Returns for week ending 3/19/10

Model portfolio, hypothetical returns for past…
1 week: -1.2%

Value of $10,000 invested at inception in 2003: $52,523

Sunday, March 14, 2010


Returns for week ending 3/12/10

Model portfolio, hypothetical returns for past…
1 week: +0.9%

Value of $10,000 invested at inception in 2003: $53,152

Sunday, March 7, 2010


Returns for week ending 3/5/10

Model portfolio, hypothetical returns for past…
1 week: +0.2%

Value of $10,000 invested at inception in 2003: $52,804

Monday, March 1, 2010

Due to my schedule over the next couple of weeks I am making an abbreviated posting and will update with a more complete posting at some point soon.

Holdings for next week (10):
CTRP NIHD TSTC HMIN GMCR ISRG BCSI NTY VNR MELI

Remove half of the hedge (TWM) this week, resulting in a Net-50%-Long allocation. (Same as last week)

(Note that TWM is a 2x leveraged inverse fund, so your TWM holding should equal 25% of the total of your other holdings to achieve a Net-50%-Long allocation.)

Saturday, February 20, 2010

Due to my schedule over the next couple of weeks I am making an abbreviated posting and will update with a more complete posting at some point soon.

Holdings for next week (9):
BIDU TSTC HMIN ISRG GMCR MELI NTY VNR RAX.

Remove half of the hedge (TWM) this week, resulting in a Net-50%-Long allocation

Sunday, February 14, 2010


Returns for week ending 2/12/10

Model portfolio, hypothetical returns for past…
1 week: +0.1%

Value of $10,000 invested at inception in 2003: $51,741

Monday, February 8, 2010


Returns for week ending 2/5/10

Model portfolio, hypothetical returns for past…
1 week: -2.1%

Value of $10,000 invested at inception in 2003: $51,657

Monday, February 1, 2010

Returns for week ending 1/29/10

Model portfolio, hypothetical returns for past…
1 week: -3.6%

Value of $10,000 invested at inception in 2003: $52,778

Returns for week ending 1/29/10

Model portfolio, hypothetical returns for past…
1 week: -3.6%

Value of $10,000 invested at inception in 2003: $52,778

Sunday, January 24, 2010


Returns for week ending 1/22/10

Model portfolio, hypothetical returns for past…
1 week: -1.1%

Value of $10,000 invested at inception in 2003: $54,750

Monday, January 18, 2010


Returns for week ending 1/15/10

Model portfolio, hypothetical returns for past…
1 week: -5.0%

Value of $10,000 invested at inception in 2003: $55,328